Data Synthesis: Analyzing the SCM Supply
- Mao Polosky
- Feb 28, 2024
- 3 min read

Updated: Mar 3, 2024
The Data/Literature Review Process
Since it seems that the burning of the CSA (Coconut Shell Ash to partially replace cement) is taking longer than expected (more on that in another post), and Nick at Fortera is kindly burning the CSA at around 800-900 Celsius for me, I'm using my time to start analyzing how the supply of coconut shell ash stacks up. Below are the results so far, using the most recent and reliable data I could find to make these graphs.
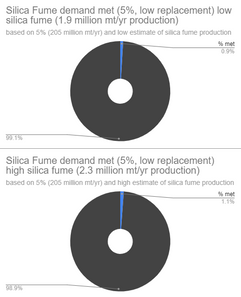
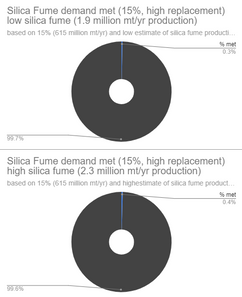
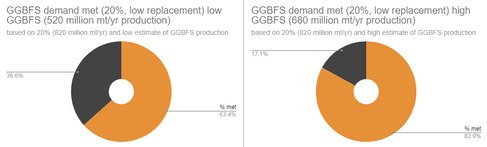
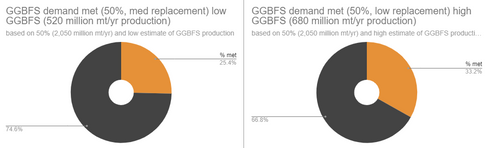
The pie charts show, if (theoretically) cement replacements replace cement (by weight) at literature ideal replacement ranges, for all cement, then what percentage of that overall replacement demand could the (theoretical) world supply of that replacement meet (per year). I created charts at the lowest and highest % replacements for the SCMs, so the real % of demand met is probably in-between what I have. For some SCMs, there were also an estimate range of yearly production, so I also used the highest and lowest production estimates to create two graphs.
So far, I've covered the SCMs: Fly Ash Class C, Fly Ash Class F (both from coal burning), Silica Fume (from silicon/ferrosilicon production), and Ground Granulated Blast Furnace Slag (GGBFS) from iron manufacturing. These are the most common SCMs and are generally waste material. You can also see in the Coconut Production graph that I've started looking at how CSA stacks up to these other common SCMs.
The calculations were a bit complex, so here's an example:
If we make 4.1 billion metric tonnes of cement per year, and we wanted to replace 25% of that with Fly Ash (FA) Class F (25% is the high estimate of ideal replacement percentage of FA Class F with cement), then we would need a bit over 1,025 million metric tonnes of this FA Class F per year to totally cover that demand, but we only make around 740 million metric tonnes of FA Class F per year (2022 data), therefore, (740million mt/yr SCM made) / (1,025 million mt/yr SCM needed) * 100% equals 72.1% of this theoretical demand met (as seen in the 4th image below).


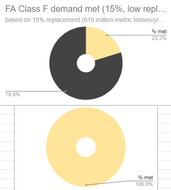


(Note: the Fly Ash Class F pie chart with 15% replacement (second row left) is supposed to represent 120.2% demand met, thus the 100% graph and the 20.2% graph)
Calculations and Complications
The data hasn't always looked this good, in fact, I had to scour many sources, such as the US mineral and commodity summaries (for production numbers), Our World in Data (for coal usage in different countries) and various research papers for how much SCM is produced from the production of these products (per metric tonne). I also had to separate calculations based on 1) Varying production estimates and 2) Different percentages of replacement of cement by that particular SCM.
(For the Fly Ash, I had to take coal power production and convert that to coal usage then convert that to how much of each type of fly ash (C or F) was produced. It was mind-boggling)
And even after all of this, my data is only a relative estimate, since there are other factors not considered such as 1) Amount of the SCM used for non-cement-replacing uses (asphalt, bricks, etc.) and 2) The amount of cement already being replaced by the SCMs, as SCM use is fairly commonplace already. 3) There are other circumstances such as not all the SCM being captured (like Fly Ash in Chinese coal plants) or collected/sold, and certain locations not being able to access SCMs (due to distance and/or politics). In general, this means that the actual usable supply of SCMs is likely significantly lower than my estimated demand percentages met, but I think they still tell something about how the SCMs stack up compared to eachother.

(my google sheet skills have been tested by this back-breaking data work)
My Plans
I plan to continue this data search/summary with agricultural SCMs such as Rice Husk Ash, Palm Oil Fuel Ash, Sugarcane Bagasse Ash, and of course, Coconut Shell Ash (CSA) itself, as these are all plant-based SCMs similar to CSA. After, I plan to investigate the costs of the SCMs.
In general, this work is important because the cement/concrete industry is so massive (remember: 4.1 billion tons of cement made per year) that production numbers and money matter a lot. Even if the science is sound (which I'm investigating later), these other factors can still render certain SCMs useless if they don't meet industry demand.
Until next time,
Max Polosky


Comments